object
|
An object supported by “procast”.
|
plot
|
Should the plot or autoplot method be called to draw all chosen plots? Either set plot expicitly to “base” vs. “ggplot2” to choose the type of plot, or for a logical plot argument it’s chosen conditional if the package ggplot2 is loaded.
|
class
|
Should the invisible return value be either a data.frame or a tibble. Either set class expicitly to “data.frame” vs. “tibble”, or for NULL it’s chosen automatically conditional if the package tibble is loaded.
|
newdata
|
optionally, a data frame in which to look for variables with which to predict. If omitted, the original observations are used.
|
na.action
|
function determining what should be done with missing values in newdata. The default is to employ NA.
|
which
|
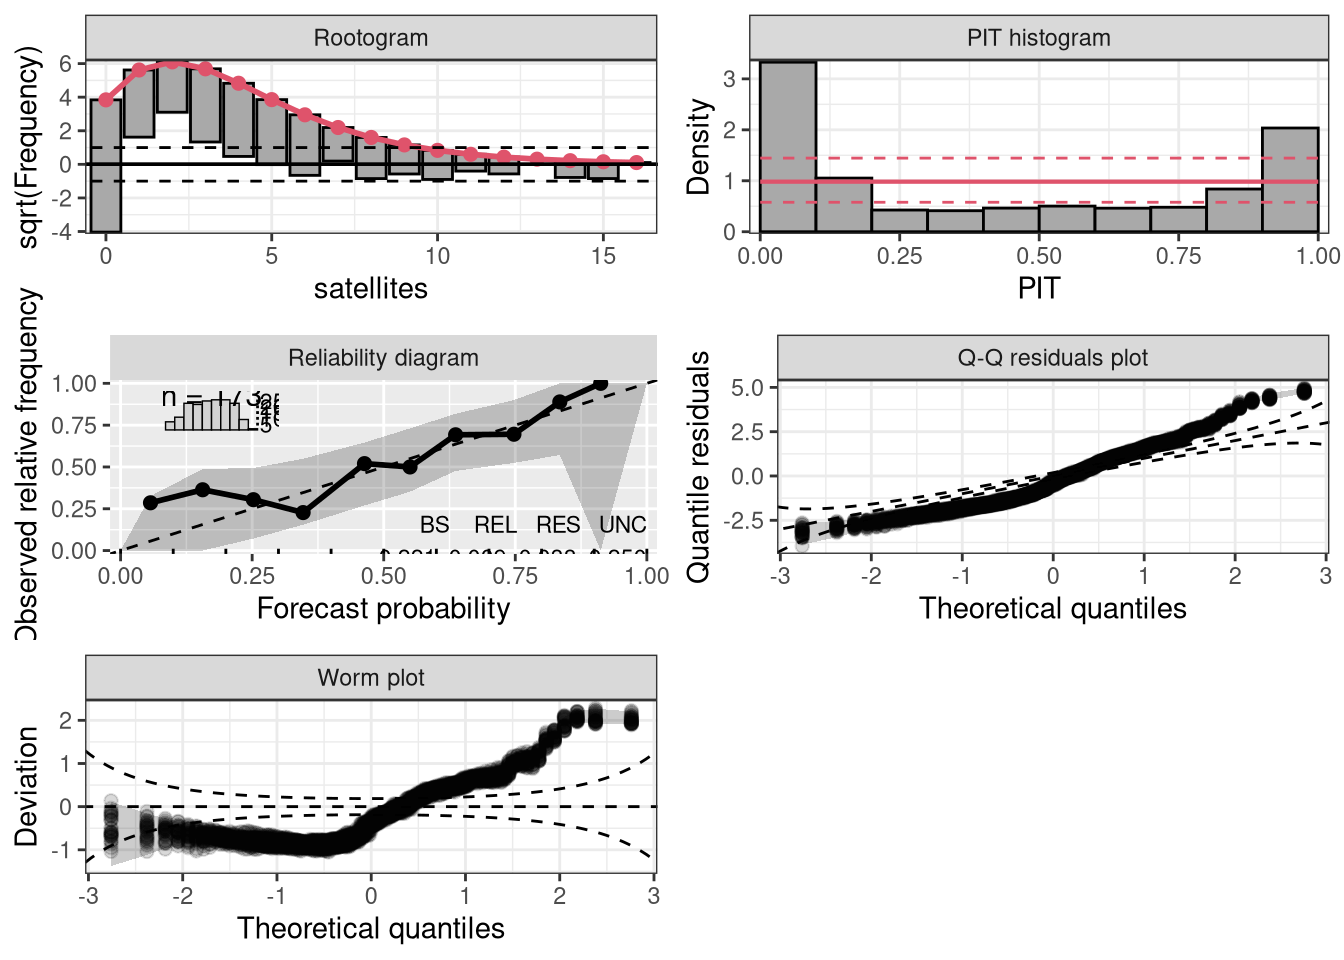
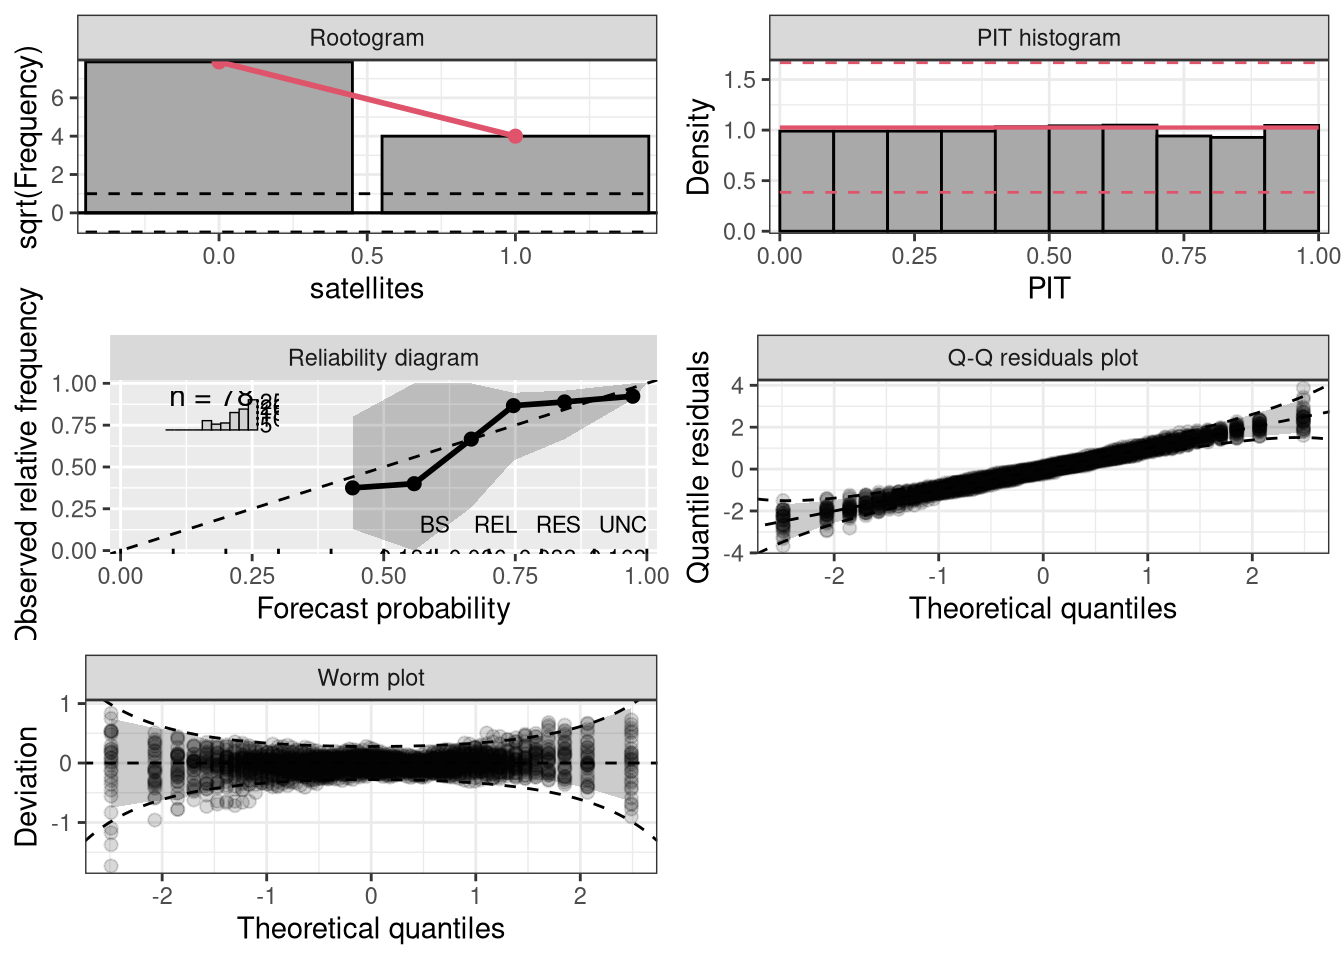
Character or integer, selects the type of plot: “rootogram” graphically compares (square roots) of empirical frequencies with fitted frequencies from a probability model, “pithist” compares empirical probabilities from fitted models with a uniform distribution, “reliagram” shows a reliability diagram for assessing the reliability of a fitted probabilistic distributional forecast, “qqrplot” shows a quantile-quantile plot of quantile residuals, and “wormplot” shows a worm plot using quantile resiudals.
|
ask
|
For multiple plots, the user is asked to show the next plot. Argument is ignored for ggplot2 style graphics.
|
spar
|
Should graphical parameters be set? Will be ignored for ggplot2 style graphics.
|
single_page
|
Logical. Should all plots be shown on a single page? Only choice for ggplot2 style graphics.
|
envir
|
environment, default is parent.frame()
|
…
|
Arguments to be passed to rootogram, pithist, reliagram, qqrplot, and wormplot.
|