Oral Health in Children in The Netherlands

Description

Data from a study on oral health status and the preventive dental behaviors of 9-year-old children in The Netherlands.

Usage

data("OralHealthNL")

Format

A data frame containing 440 observations on 8 variables.

dmfs
Numeric index of decayed, missing, and filled surfaces (DMFS) in deciduous teeth.
education
Factor indicating whether the highest completed education level of the mother is “high” (senior general secondary education, HAVO, or higher) or “low”.
gender
Factor indicating gender of the child (“female” or “male”).
ethnicity
Factor indicating whether the mother is “immigrant” (born abroad) or “native” (born in The Netherlands).
brushing
Factor indicating whether the frequency of brushing teeth is “< 2” or “>= 2” times per day.
breakfast
Factor indicating whether the frequency of having breakfast is “7” or “< 7” days per week.
fooddrink
Factor indicating whether the frequency of food and drinks in addition to the three main meals is “<= 7” or “> 7” times per day.
corah
Factor indicating whether Corah’s Dental Anxiety score is “< 13” or “>= 13” (see also below).

Details

The data are from the study “Oral Health in Children and Adolescents in The Netherlands” (Schuller et al. 2011). The aim of this study was to describe the oral health status and the preventive dental behaviors of children from different age groups (Dusseldorp et al. 2015). Here, the subset of children at the age of 9 years is provided as analyzed by Hofstetter et al. (2016).

The data collection consisted of a clinical oral examination and a questionnaire survey, using a repeated cross-sectional design. Data contained information about demographic variables (ethnicity and educational level), nutrition, children’s dental attendance, oral self-care, and dental anxiety. The score on Corah’s Dental Anxiety Questionnaire was used as a measure of dental anxiety. This questionnaire consists of four questions with answer categories from 1 (low anxiety) to 5 (high anxiety). A total Corah score was computed by taking the sum of the four items and then dichotomized into ‘lower than 13’ and ‘higher than or equal to 13’.

Source

Supplementary materials for Hofstetter et al. (2016). doi:10.1159/000448197

References

Dusseldorp E, Kamphuis M, Schuller AA (2015). “Impact of Lifestyle Factors on Caries Experience in Three Different Age Groups: 9, 15, and 21-Year-Olds”, Community Dentistry and Oral Epidemiology, 43(1), 9–16. doi:10.1111/cdoe.12123

Hofstetter H, Dusseldorp E, Zeileis A, Schuller AA (2016). “Modeling Caries Experience: Advantages of the Use of the Hurdle Model”, Caries Research, 50(6), 517–526. doi:10.1159/000448197

Schuller AA, Poorterman JHG, van Kempen CPF, Dusseldorp E, van Dommelen P, Verrips GHW (2011). Kies voor tanden: Een onderzoek naar mondgezondheid en preventief tandheelkundig gedrag van jeugdigen. Tussenmeting 2009, een vervolg op de reeks TJZ-onderzoeken. TNO, Leiden.

Examples

library("countreg")

## Load data and omit NAs and one dmfs outlier
data("OralHealthNL", package = "countreg")
head(OralHealthNL)
  dmfs education gender ethnicity brushing breakfast fooddrink corah
1    1       low   male    native     >= 2         7      <= 7  <NA>
2    0      high   male    native     >= 2         7      <= 7  <NA>
3    6      high female    native     >= 2         7      <= 7  < 13
4    9       low female    native     >= 2         7       > 7  < 13
5    0      high female    native      < 2         7      <= 7  <NA>
6    0       low   male    native     >= 2         7      <= 7  < 13
OralHealthNL <- na.omit(subset(OralHealthNL, dmfs < 40))

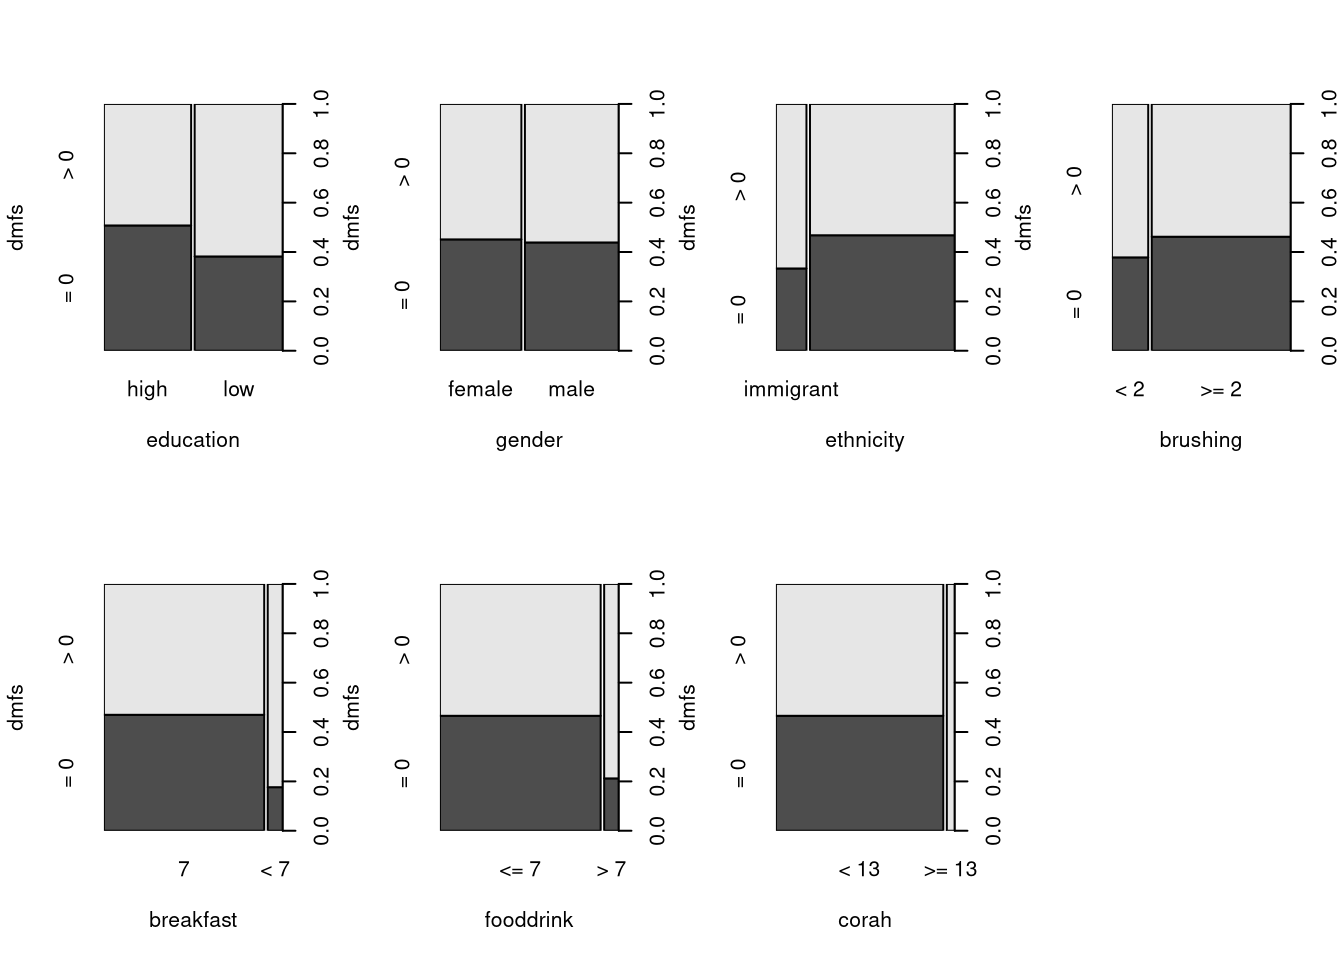
## Visualization: Is dmfs > 0?
par(mfrow = c(2, 4))
plot(factor(dmfs > 0, levels = c(TRUE, FALSE), labels = c("> 0", "= 0")) ~ .,
  data = OralHealthNL, ylab = "dmfs")

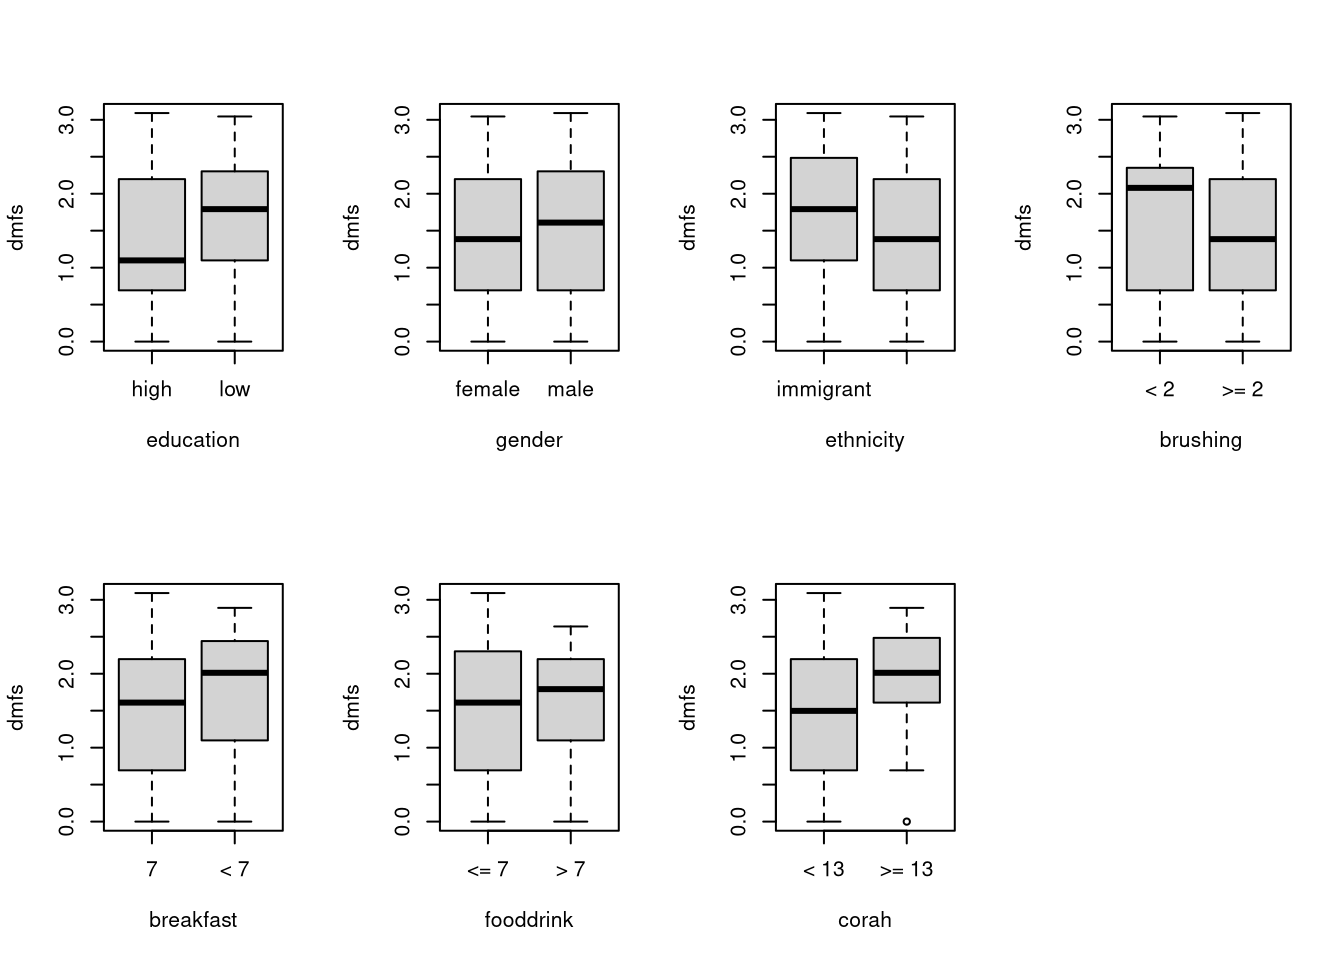
## Count: How large is log(dmfs) given dmfs > 0?
par(mfrow = c(2, 4))

plot(log(dmfs) ~ ., data = OralHealthNL, subset = dmfs > 0, ylab = "dmfs")

## Relevel the factor variables so that non-risk group is the reference
OralHealthNL <- transform(OralHealthNL,
  ethnicity = relevel(ethnicity, ref = "native"),
  brushing = relevel(brushing, ref = ">= 2"),
  breakfast = relevel(breakfast, ref = "7")
)

## Count regression models
zinb <- zeroinfl(dmfs ~ ., data = OralHealthNL, dist = "negbin")
zip  <- zeroinfl(dmfs ~ ., data = OralHealthNL, dist = "poisson")
hnb  <-   hurdle(dmfs ~ ., data = OralHealthNL, dist = "negbin")
hp   <-   hurdle(dmfs ~ ., data = OralHealthNL, dist = "poisson")

## Model comparisons (Table 3)
## Information criteria
cbind(AIC(hnb, zinb, hp, zip), BIC = BIC(hnb, zinb, hp, zip)[, 2])
     df      AIC      BIC
hnb  17 1710.477 1778.161
zinb 17 1712.954 1780.638
hp   16 1969.529 2033.232
zip  16 1969.571 2033.274
## Negative binomial vs. Poisson
if(require("lmtest")) lrtest(hnb, hp)
Likelihood ratio test

Model 1: dmfs ~ .
Model 2: dmfs ~ .
  #Df  LogLik Df  Chisq Pr(>Chisq)    
1  17 -838.24                         
2  16 -968.76 -1 261.05  < 2.2e-16 ***
---
Signif. codes:  0 '***' 0.001 '**' 0.01 '*' 0.05 '.' 0.1 ' ' 1
if(require("lmtest")) lrtest(zinb, zip)
Likelihood ratio test

Model 1: dmfs ~ .
Model 2: dmfs ~ .
  #Df  LogLik Df  Chisq Pr(>Chisq)    
1  17 -839.48                         
2  16 -968.79 -1 258.62  < 2.2e-16 ***
---
Signif. codes:  0 '***' 0.001 '**' 0.01 '*' 0.05 '.' 0.1 ' ' 1
## Zero-inflation vs. hurdle
if(require("nonnest2")) vuongtest(zinb, hnb)

Model 1 
 Class: zeroinfl 
 Call: zeroinfl(formula = dmfs ~ ., data = OralHealthNL, dist = "negbin")

Model 2 
 Class: hurdle 
 Call: hurdle(formula = dmfs ~ ., data = OralHealthNL, dist = "negbin")

Variance test 
  H0: Model 1 and Model 2 are indistinguishable 
  H1: Model 1 and Model 2 are distinguishable 
    w2 = 0.001,   p = 0.382

Non-nested likelihood ratio test 
  H0: Model fits are equal for the focal population 
  H1A: Model 1 fits better than Model 2 
    z = -2.511,   p = 0.994
  H1B: Model 2 fits better than Model 1 
    z = -2.511,   p = 0.006015
## Coefficients, odds ratios, and rate ratios
## Negative binomial hurdle model (Table 3)
summary(hnb)

Call:
hurdle(formula = dmfs ~ ., data = OralHealthNL, dist = "negbin")

Pearson residuals:
    Min      1Q  Median      3Q     Max 
-1.0564 -0.6754 -0.4458  0.3831  4.2094 

Count model coefficients (truncated negbin with log link):
                   Estimate Std. Error z value Pr(>|z|)    
(Intercept)         1.29286    0.13110   9.861  < 2e-16 ***
educationlow        0.30434    0.12956   2.349  0.01883 *  
gendermale          0.05017    0.12481   0.402  0.68772    
ethnicityimmigrant  0.33572    0.15078   2.227  0.02598 *  
brushing< 2         0.37770    0.14319   2.638  0.00835 ** 
breakfast< 7        0.13758    0.18510   0.743  0.45732    
fooddrink> 7       -0.08250    0.19674  -0.419  0.67497    
corah>= 13          0.38452    0.22072   1.742  0.08148 .  
Log(theta)          0.51214    0.18669   2.743  0.00608 ** 
Zero hurdle model coefficients (binomial with logit link):
                    Estimate Std. Error z value Pr(>|z|)   
(Intercept)         -0.32742    0.19784  -1.655  0.09794 . 
educationlow         0.40429    0.21393   1.890  0.05877 . 
gendermale          -0.04384    0.21348  -0.205  0.83729   
ethnicityimmigrant   0.48796    0.29112   1.676  0.09371 . 
brushing< 2          0.26244    0.26812   0.979  0.32766   
breakfast< 7         1.25730    0.47601   2.641  0.00826 **
fooddrink> 7         0.98360    0.45653   2.155  0.03120 * 
corah>= 13          16.14670  865.49661   0.019  0.98512   
---
Signif. codes:  0 '***' 0.001 '**' 0.01 '*' 0.05 '.' 0.1 ' ' 1 

Theta: count = 1.6689
Number of iterations in BFGS optimization: 17 
Log-likelihood: -838.2 on 17 Df
exp(confint(hnb))
                             2.5 %   97.5 %
count_(Intercept)        2.8176305 4.710609
count_educationlow       1.0516938 1.747675
count_gendermale         0.8232799 1.342851
count_ethnicityimmigrant 1.0410117 1.879962
count_brushing< 2        1.1019136 1.931618
count_breakfast< 7       0.7983455 1.649344
count_fooddrink> 7       0.6261915 1.354050
count_corah>= 13         0.9530647 2.263966
zero_(Intercept)         0.4890990 1.062205
zero_educationlow        0.9851189 2.278641
zero_gendermale          0.6298696 1.454358
zero_ethnicityimmigrant  0.9206978 2.882191
zero_brushing< 2         0.7686977 2.198867
zero_breakfast< 7        1.3831085 8.937661
zero_fooddrink> 7        1.0928891 6.542907
zero_corah>= 13          0.0000000      Inf
## Negative binomial zero-inflated model (Table 4)
summary(hnb)

Call:
hurdle(formula = dmfs ~ ., data = OralHealthNL, dist = "negbin")

Pearson residuals:
    Min      1Q  Median      3Q     Max 
-1.0564 -0.6754 -0.4458  0.3831  4.2094 

Count model coefficients (truncated negbin with log link):
                   Estimate Std. Error z value Pr(>|z|)    
(Intercept)         1.29286    0.13110   9.861  < 2e-16 ***
educationlow        0.30434    0.12956   2.349  0.01883 *  
gendermale          0.05017    0.12481   0.402  0.68772    
ethnicityimmigrant  0.33572    0.15078   2.227  0.02598 *  
brushing< 2         0.37770    0.14319   2.638  0.00835 ** 
breakfast< 7        0.13758    0.18510   0.743  0.45732    
fooddrink> 7       -0.08250    0.19674  -0.419  0.67497    
corah>= 13          0.38452    0.22072   1.742  0.08148 .  
Log(theta)          0.51214    0.18669   2.743  0.00608 ** 
Zero hurdle model coefficients (binomial with logit link):
                    Estimate Std. Error z value Pr(>|z|)   
(Intercept)         -0.32742    0.19784  -1.655  0.09794 . 
educationlow         0.40429    0.21393   1.890  0.05877 . 
gendermale          -0.04384    0.21348  -0.205  0.83729   
ethnicityimmigrant   0.48796    0.29112   1.676  0.09371 . 
brushing< 2          0.26244    0.26812   0.979  0.32766   
breakfast< 7         1.25730    0.47601   2.641  0.00826 **
fooddrink> 7         0.98360    0.45653   2.155  0.03120 * 
corah>= 13          16.14670  865.49661   0.019  0.98512   
---
Signif. codes:  0 '***' 0.001 '**' 0.01 '*' 0.05 '.' 0.1 ' ' 1 

Theta: count = 1.6689
Number of iterations in BFGS optimization: 17 
Log-likelihood: -838.2 on 17 Df
exp(confint(zinb))
                              2.5 %    97.5 %
count_(Intercept)        2.87728799 4.7399839
count_educationlow       1.05358981 1.7408558
count_gendermale         0.83032458 1.3392020
count_ethnicityimmigrant 1.03700891 1.8491811
count_brushing< 2        1.08222465 1.8760869
count_breakfast< 7       0.81383157 1.6536956
count_fooddrink> 7       0.63596745 1.3590801
count_corah>= 13         1.01247274 2.3333949
zero_(Intercept)         0.67229117 1.6908065
zero_educationlow        0.43459181 1.1554917
zero_gendermale          0.66228485 1.7408712
zero_ethnicityimmigrant  0.32595659 1.2220538
zero_brushing< 2         0.42567249 1.4411974
zero_breakfast< 7        0.06835275 0.8785863
zero_fooddrink> 7        0.08307571 1.0765754
zero_corah>= 13          0.00000000       Inf
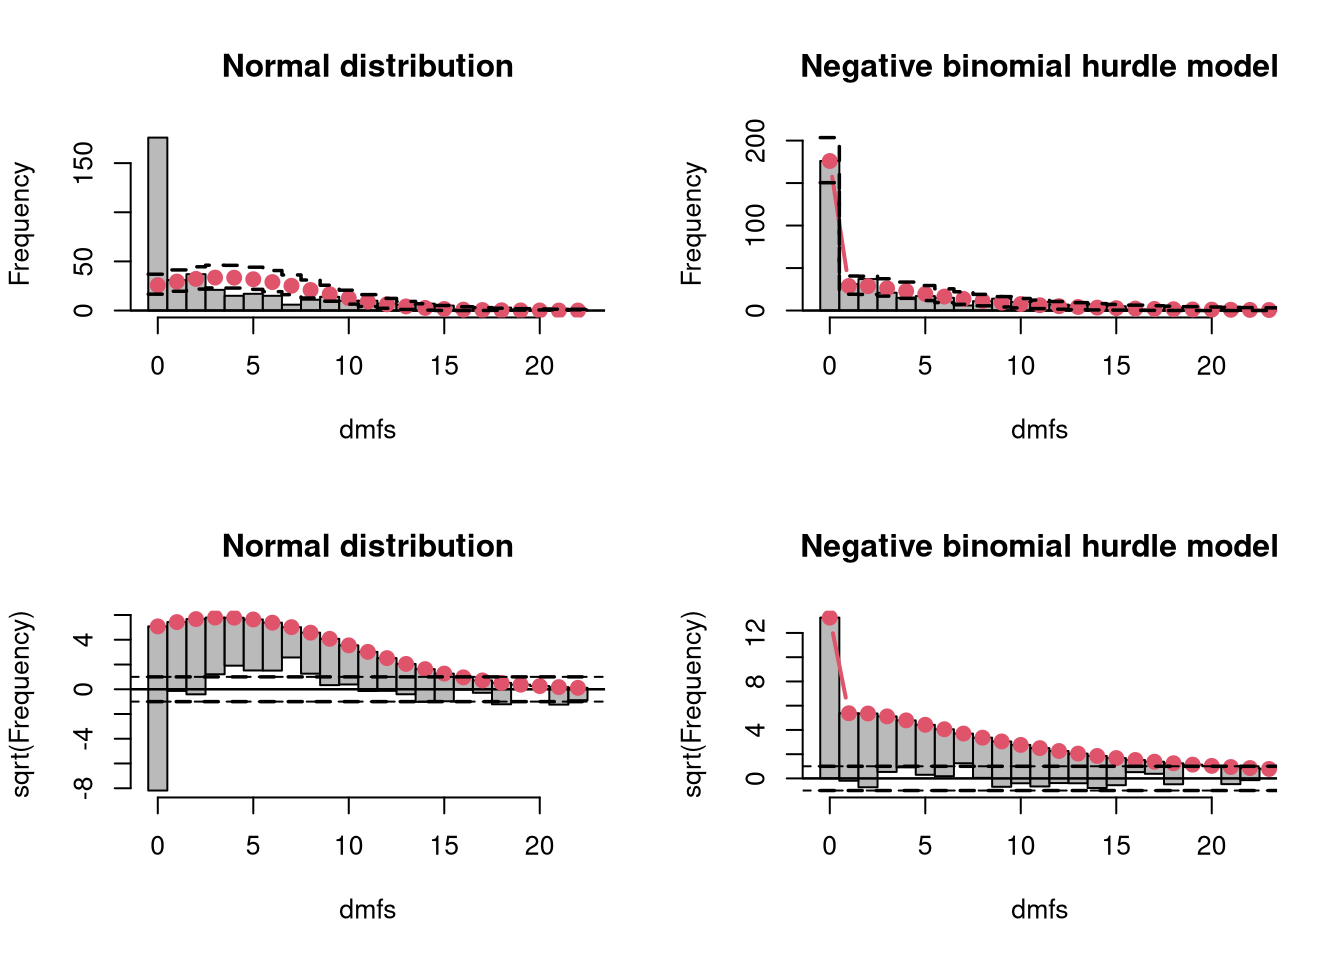
## Rootograms (top left: Figure 1)
if(require("topmodels")) {
par(mfrow = c(2, 2))
rootogram(lm(OralHealthNL$dmfs ~ 1),
  style = "standing", scale = "raw",
  breaks = 0:23 - 0.5, xlim = c(-0.5, 22.5),
  xlab = "dmfs", main = "Normal distribution")
rootogram(hnb,
  style = "standing", scale = "raw",
  width = 1, xlim = c(-0.5, 22.5),
  xlab = "dmfs", main = "Negative binomial hurdle model")
rootogram(lm(OralHealthNL$dmfs ~ 1),
  breaks = 0:23 - 0.5, xlim = c(-0.5, 22.5),
  xlab = "dmfs", main = "Normal distribution")
abline(h = c(-1, 1), lty = 2)
rootogram(hnb,
  width = 1, xlim = c(-0.5, 22.5),
  xlab = "dmfs", main = "Negative binomial hurdle model")
abline(h = c(-1, 1), lty = 2)
par(mfrow = c(1, 1))
}

## Number of zeros
c(dmfs = sum(OralHealthNL$dmfs == 0),
  ZINB = sum(predict(zinb, type = "density", at = 0)),
  Hurdle = sum(predict(hnb, type = "density", at = 0)))
    dmfs     ZINB   Hurdle 
176.0000 177.1231 176.0000 
## Correlation of observations and fitted means
cor(cbind(dmfs = OralHealthNL$dmfs,
  ZINB = fitted(zinb), HNB = fitted(hnb)))
          dmfs     ZINB       HNB
dmfs 1.0000000 0.348679 0.3490063
ZINB 0.3486790 1.000000 0.9997870
HNB  0.3490063 0.999787 1.0000000
## Bias-reduced logistic regression (due to separation)
if(require("brglm2")) {
br <- glm(
  factor(dmfs == 0, levels = c(TRUE, FALSE), labels = c("= 0", "> 0")) ~ .,
  data = OralHealthNL, family = binomial, method = "brglmFit")
print(coeftest(br), digits = 1)
}

z test of coefficients:

                   Estimate Std. Error z value Pr(>|z|)  
(Intercept)           -0.32       0.20    -1.6     0.10  
educationlow           0.40       0.21     1.9     0.06 .
gendermale            -0.04       0.21    -0.2     0.84  
ethnicityimmigrant     0.47       0.29     1.6     0.10  
brushing< 2            0.26       0.27     1.0     0.34  
breakfast< 7           1.19       0.46     2.6     0.01 *
fooddrink> 7           0.93       0.45     2.1     0.04 *
corah>= 13             3.33       1.48     2.3     0.02 *
---
Signif. codes:  0 '***' 0.001 '**' 0.01 '*' 0.05 '.' 0.1 ' ' 1