Data on parasite infection in cod along the coast of Finmark.
Usage
data("CodParasites")
Format
A data frame containing 1254 observations on 10 variables.
intensity
Number of parasites.
prevalence
Factor indicating presence of parasites (i.e., intensity > 0).
area
Factor indicating sampling area.
year
Factor indicating sampling year.
depth
Depth at which the fish were caught.
weight
Weight of the fish.
length
Length of the fish.
sex
Factor indicating sex of the fish.
stage
Factor indicating stage of the fish.
age
Age of the fish.
Details
The red king crab Paralithodes camtschaticus was deliberately introduced to the Barents Sea in the 1960s and 1970s from its native area in the North Pacific. The carapace of these crabs is used by the leech Johanssonia arctica to deposit its eggs. The leech in turn is a vector for the blood parasite Trypanosoma murmanensis that can infect marine fish, including cod.
Hemmingsen et al. (2005) examined cod for trypanosome infections during annual cruises along the coast of Finnmark in North Norway over three successive years and in four different areas (A1 Sørøya; A2 Magerøya; A3 Tanafjord; A4 Varangerfjord). They show that trypanosome infections are strongest in the area Varangerfjord where the density of of red king crabs is highest. Thus, there is evidence that the introduction of the foreign red king crabs had an indirect detrimental effect on the health of the native cod population. This situation stands out because it is not an introduced parasite that is dangerous for a native host, but rather an introduced host that promotes transmission of two endemic parasites.
Zuur et al. (2009) reanalyze the data using binary and count data regression models in Chapters 10.2.2, 11.3.2, 11.4.2, 11.5.2.
Hemmingsen W, Jansen PA, MacKenzie K (2005). “Crabs, Leeches and Trypanosomes: An Unholy Trinity?”, Marine Pollution Bulletin50(3), 336–339.
Zuur AF, Ieno EN, Walker NJ, Saveliev AA, Smith GM (2009). Mixed Effects Models and Extensions in Ecology with R, Springer-Verlag, New York.
Examples
library("countreg")## load datadata("CodParasites", package ="countreg")## Table 1 from Hemmingsen et al. (2005)## number of observationsxtabs(~area+year, data =CodParasites)
## prevalence of parasites (NAs counted as "yes")tab<-xtabs(~area+year+factor(is.na(prevalence)|prevalence=="yes"), data =CodParasites)round(100*prop.table(tab, 1:2)[,,2], digits =1)
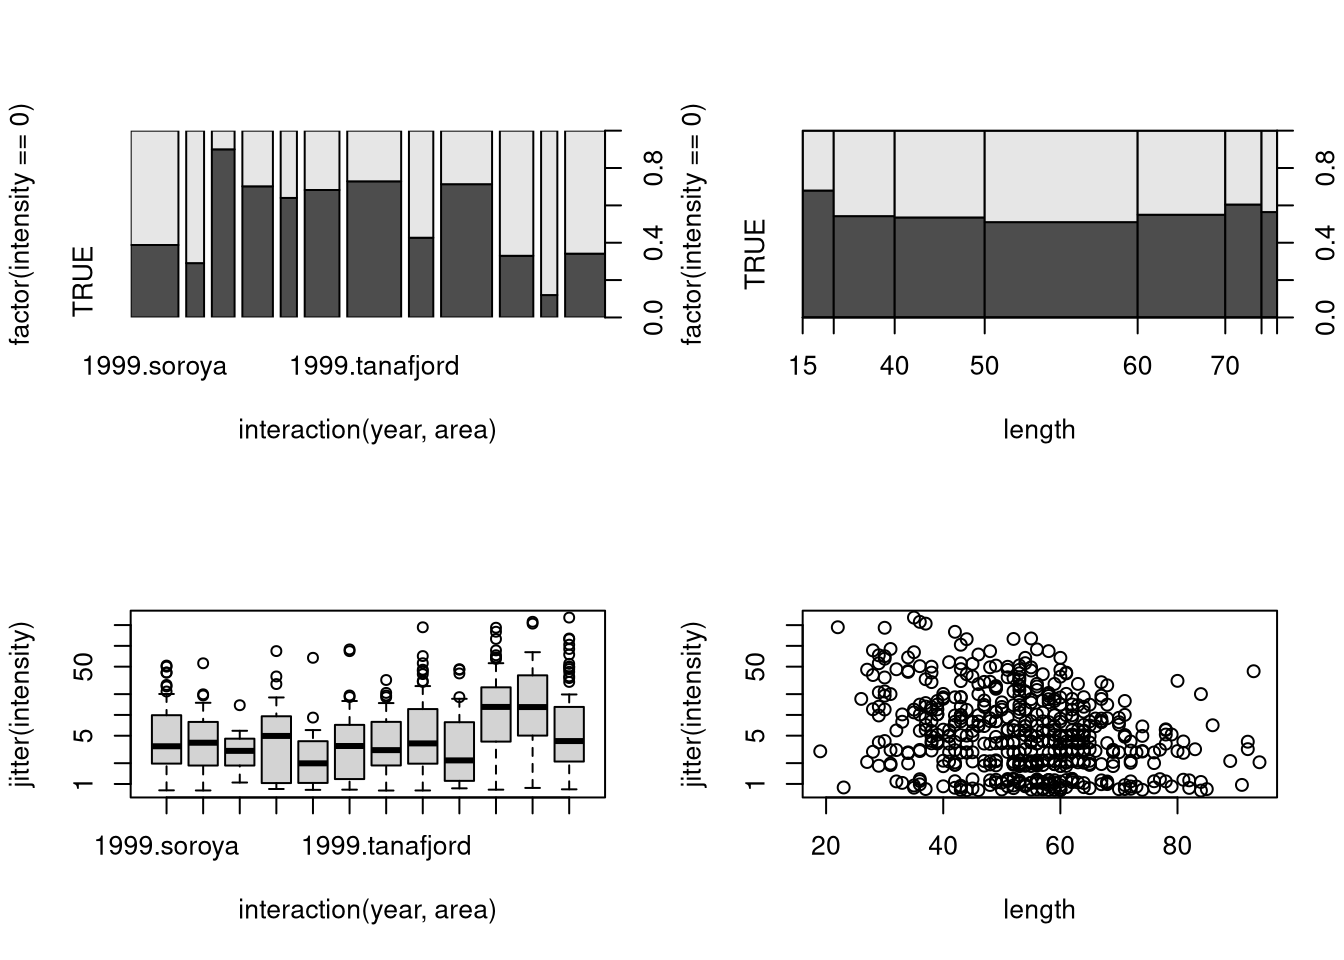
## omit NAs in responseCodParasites<-subset(CodParasites, !is.na(intensity))## exploratory displays for hurdle and countspar(mfrow =c(2, 2))plot(factor(intensity==0)~interaction(year, area), data =CodParasites)plot(factor(intensity==0)~length, data =CodParasites, breaks =c(15, 3:8*10, 105))plot(jitter(intensity)~interaction(year, area), data =CodParasites, subset =intensity>0, log ="y")plot(jitter(intensity)~length, data =CodParasites, subset =intensity>0, log ="y")
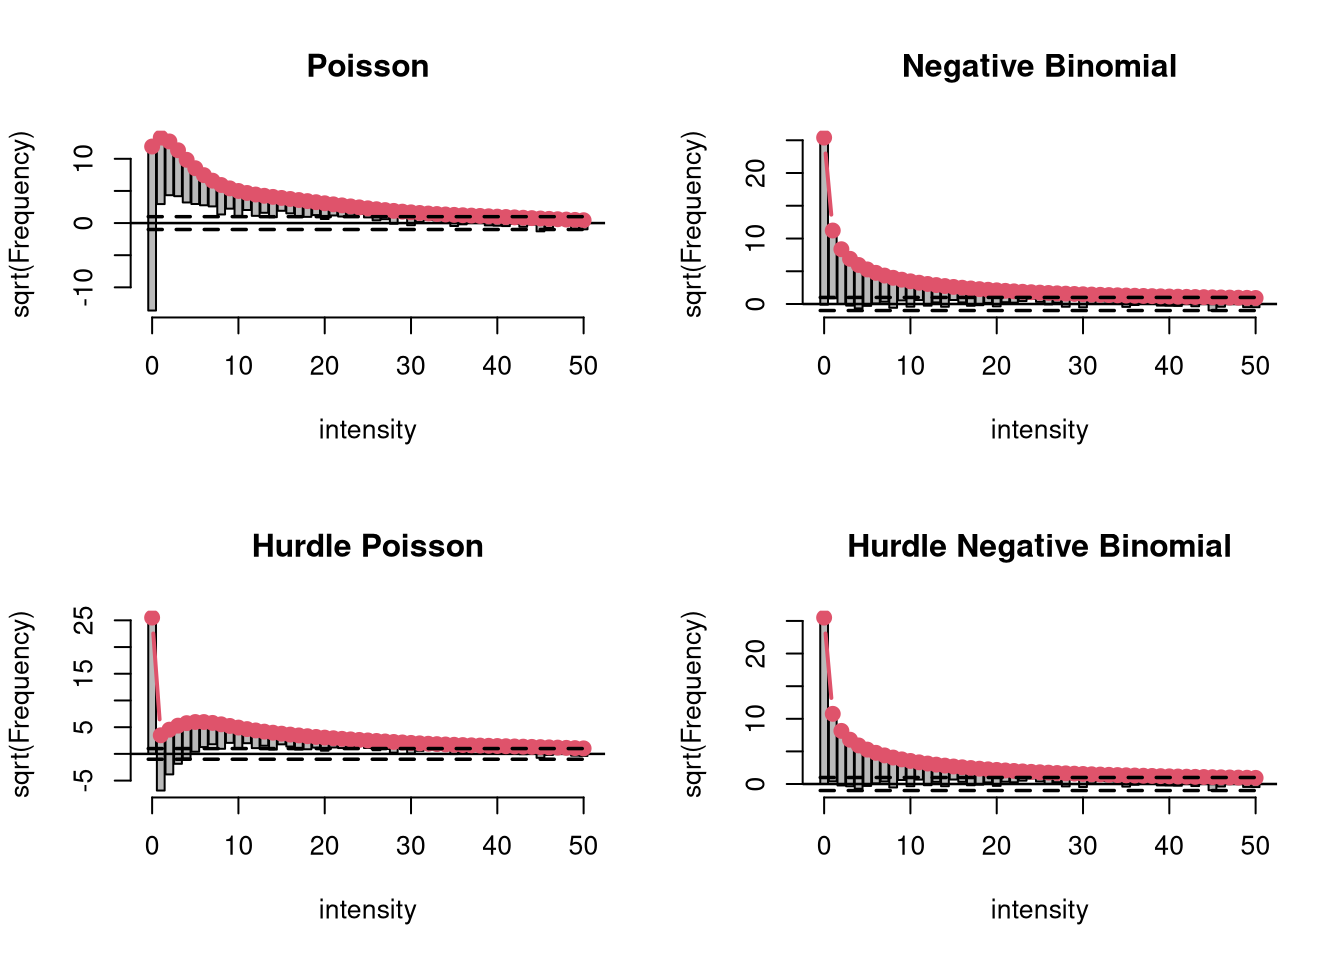
## count data modelscp_p<-glm(intensity~length+area*year, data =CodParasites, family =poisson)cp_nb<-glm.nb(intensity~length+area*year, data =CodParasites)cp_hp<-hurdle(intensity~length+area*year, data =CodParasites, dist ="poisson")cp_hnb<-hurdle(intensity~length+area*year, data =CodParasites, dist ="negbin")AIC(cp_p, cp_nb, cp_hp, cp_hnb)