geom_* and stat_* for Producing PIT Histograms with `ggplot2`
geom_pit_bar.RdVarious geom_* and stat_* used within
autoplot for producing PIT histograms.
geom_pit_bar(
  mapping = NULL,
  data = NULL,
  stat = "identity",
  position = "identity",
  na.rm = FALSE,
  show.legend = NA,
  inherit.aes = TRUE,
  ...
)

stat_pit_line(
  mapping = NULL,
  data = NULL,
  geom = "pit_line",
  position = "identity",
  na.rm = FALSE,
  show.legend = NA,
  inherit.aes = TRUE,
  ...
)

geom_pit_ref(
  mapping = NULL,
  data = NULL,
  stat = "pit_line",
  position = "identity",
  na.rm = FALSE,
  show.legend = NA,
  inherit.aes = TRUE,
  ...
)

stat_pit_ref(
  mapping = NULL,
  data = NULL,
  geom = "pit_ref",
  position = "identity",
  na.rm = FALSE,
  show.legend = NA,
  inherit.aes = TRUE,
  ...
)

stat_pit_confint(
  mapping = NULL,
  data = NULL,
  geom = "pit_confint",
  position = "identity",
  na.rm = FALSE,
  show.legend = NA,
  inherit.aes = TRUE,
  style = c("polygon", "line"),
  ...
)

geom_pit_confint(
  mapping = NULL,
  data = NULL,
  stat = "pit_confint",
  position = "identity",
  na.rm = FALSE,
  show.legend = NA,
  inherit.aes = TRUE,
  linejoin = "mitre",
  style = c("polygon", "line"),
  ...
)

geom_pit_range(
  mapping = NULL,
  data = NULL,
  stat = "identity",
  position = "identity",
  na.rm = FALSE,
  show.legend = NA,
  inherit.aes = TRUE,
  ...
)
Arguments
| mapping | Set of aesthetic mappings created by |
|---|---|
| data | The data to be displayed in this layer. There are three options: If A A |
| stat | The statistical transformation to use on the data for this layer, as a string. |
| position | Position adjustment, either as a string, or the result of a call to a position adjustment function. |
| na.rm | If |
| show.legend | logical. Should this layer be included in the legends?
|
| inherit.aes | If |
| ... | Other arguments passed on to |
| geom | The geometric object to use display the data |
| style | Fix description. |
| linejoin | Fix description. |
Examples
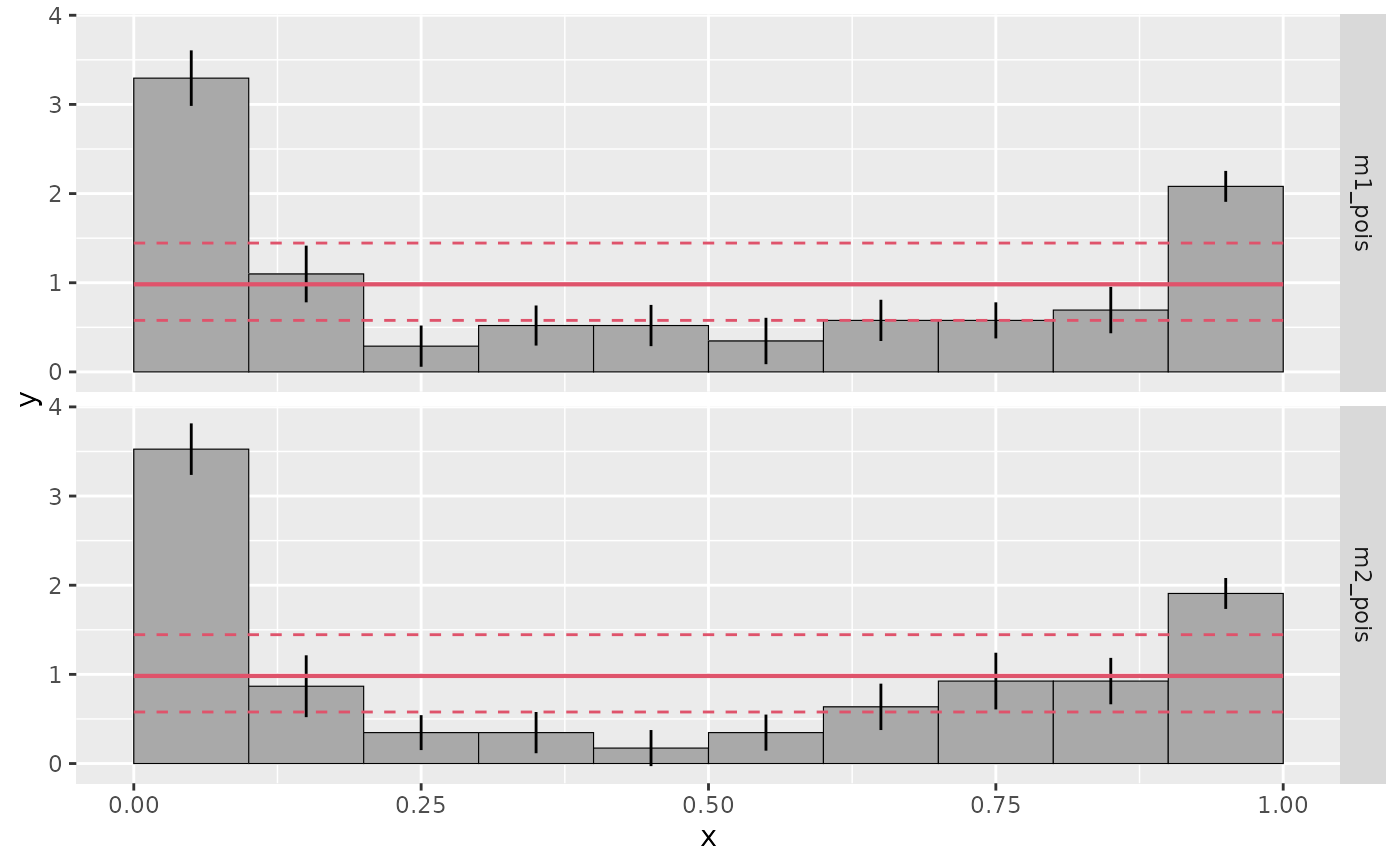
#>## Fit model data("CrabSatellites", package = "countreg") m1_pois <- glm(satellites ~ width + color, data = CrabSatellites, family = poisson) m2_pois <- glm(satellites ~ color, data = CrabSatellites, family = poisson) ## Compute pithist p1 <- pithist(m1_pois, plot = FALSE) p2 <- pithist(m2_pois, plot = FALSE) d <- c(p1, p2) ## Get label names xlab <- unique(attr(d, "xlab")) ylab <- unique(attr(d, "ylab")) main <- attr(d, "main") main <- make.names(main, unique = TRUE) d$group <- factor(d$group, labels = main) ## Plot bar style PIT histogram gg1 <- ggplot(data = d) + geom_pit_bar(aes(x = x, y = y, width = width, group = group)) + geom_pit_range(aes(x, ymin = rg_lwr, ymax = rg_upr)) + geom_pit_confint(aes(x = x, ymin = ci_lwr, ymax = ci_upr, width = width), style = "line") + geom_pit_ref(aes(x = x, y = ref, width = width)) + facet_grid(group~.) gg1## Plot line style PIT histogram gg2 <- ggplot(data = d) + geom_pit_line(aes(x = x, y = y, width = width, group = group)) + geom_pit_confint(aes(x = x, ymin = ci_lwr, ymax = ci_upr, width = width), style = "polygon") + geom_pit_ref(aes(x = x, y = ref, width = width)) + facet_grid(group~.) gg2